
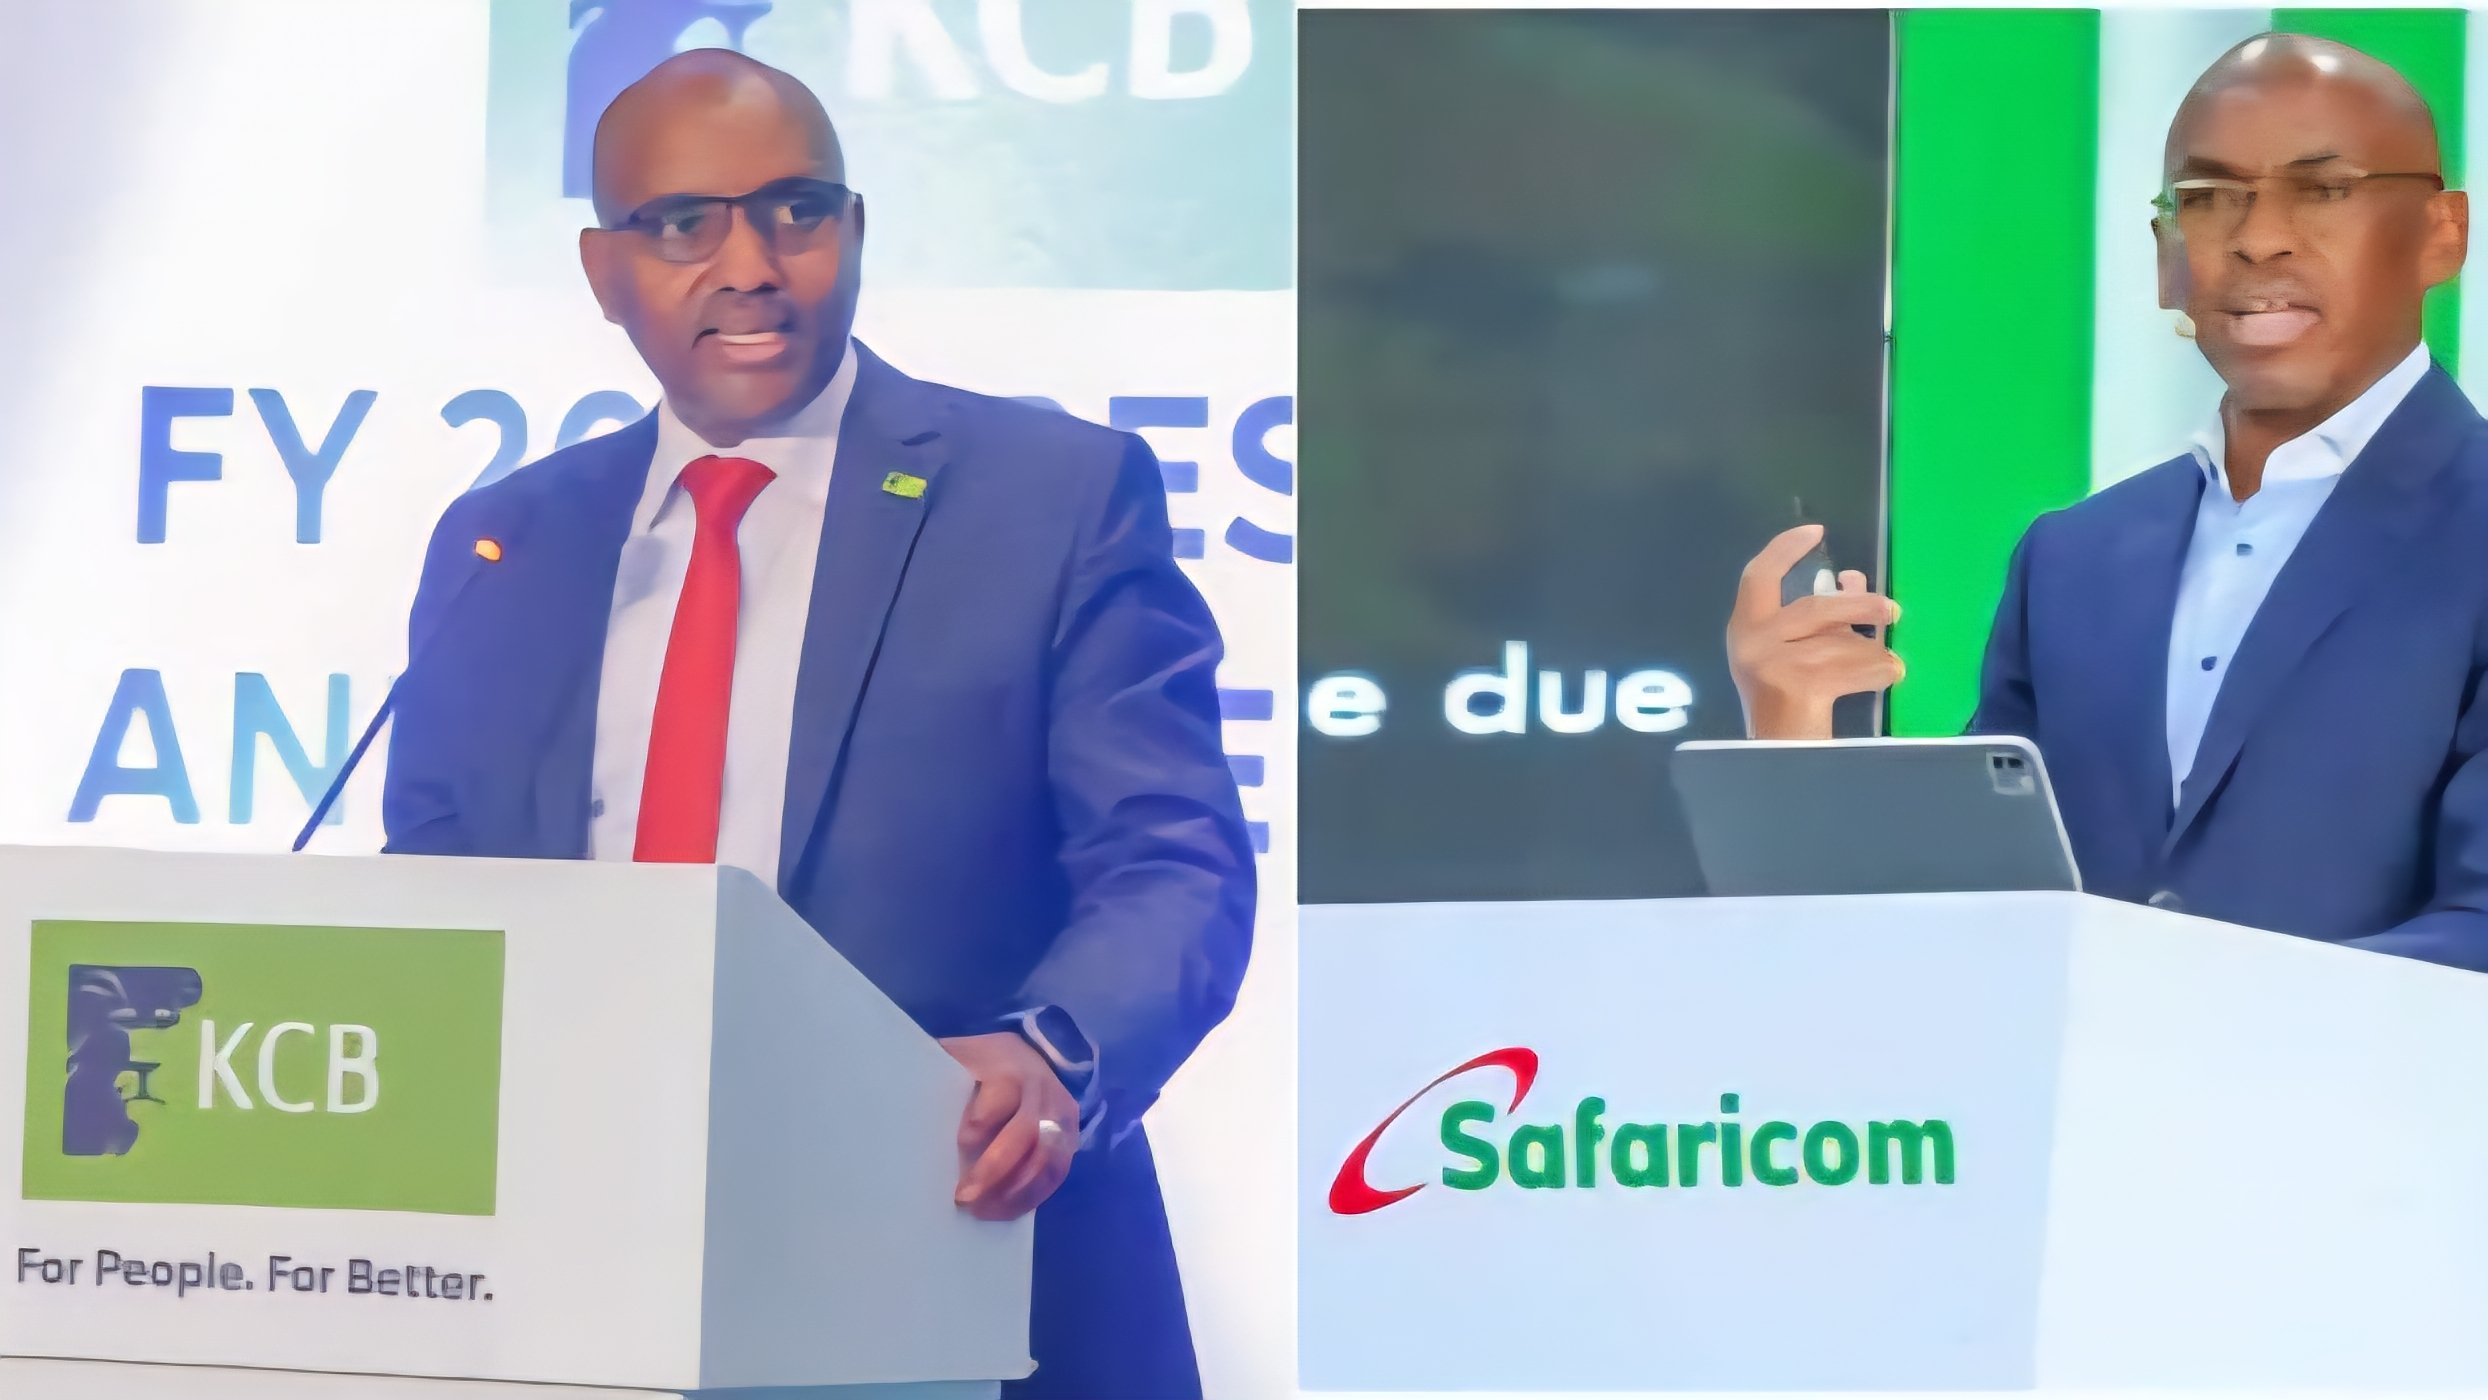

Telecommunications firm Safaricom PLC, financial services provider KCB Group, and reinsurer Kenya Reinsurance Corporation (Kenya Re) recorded the highest trading activity at the Nairobi Securities Exchange (NSE) in 2025.
Investors across the market exchanged 6.34 billion shares during the twelve-month trading period, according to official data released in the Capital Markets Authority (CMA) Annual Supervision Report.
Trading volumes across the bourse showed heavy concentration in the top tier counters, continuing a historical pattern where institutional and retail capital favors liquid equity listings.
Telecommunications giant Safaricom retained its position near the top of market activity, supported by broad investor participation across both domestic and international desks.
Banking sector equities dominated the upper ranks of turnover rankings. KCB Group led the financial institutions list, benefiting from sustained market interest alongside strong balance sheet sentiment that buoyed major banking counters throughout the financial calendar.
State-backed reinsurer Kenya Re also recorded elevated trading activity, capturing significant volume alongside other prominent listings on the exchange.
Capital markets observers note that large-cap equities provided the primary liquidity engine for the local market, maintaining active order books even during periods of broader macroeconomic shifts.
The published CMA data offers a comprehensive overview of equity performance, highlighting clear preferences among investors navigating primary and secondary trading tiers.
The full list from the regulator highlights the top ten counters that shaped total traded value and share velocity across the local bourse over the past year.
Comments (0)
Leave a Comment
No comments yet. Be the first to share your thoughts!